
개요
파이썬으로 웹페이지에서 Table을 추출 후, List로 만들어 보겠습니다. 단순히 Row by Row의 경우가 아닌 셀이 합쳐진 경우에 대해서 다뤄보겠습니다.
문제정의
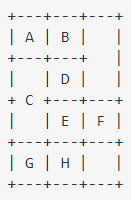
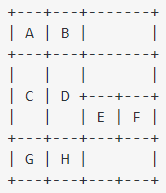
테이블은 기본적으로 n*m의 체계를 가지고 있습니다. 하지만 사용자 편의에 따라 몇몇 셀들이 합쳐지기도 합니다. 이런 테이블의 경우 단순히 한줄씩 루프를 돌리는 방식으로 해결되지 않습니다. 대표적인 형태는 아래와 같습니다.
거의 반나절을 해결해보려 했지만 결국 제 손에선 실패했습니다. 하지만 인터넷은 훌륭합니다. 코드가 있어서 첨부합니다.
def table_to_2d(table_tag):
    rowspans = []  # track pending rowspans
    rows = table_tag.find_all('tr')

    # first scan, see how many columns we need
    colcount = 0
    for r, row in enumerate(rows):
        cells = row.find_all(['td', 'th'], recursive=False)
        # count columns (including spanned).
        # add active rowspans from preceding rows
        # we *ignore* the colspan value on the last cell, to prevent
        # creating 'phantom' columns with no actual cells, only extended
        # colspans. This is achieved by hardcoding the last cell width as 1.
        # a colspan of 0 means “fill until the end” but can really only apply
        # to the last cell; ignore it elsewhere.
        colcount = max(
            colcount,
            sum(int(c.get('colspan', 1)) or 1 for c in cells[:-1]) + len(cells[-1:]) + len(rowspans))
        # update rowspan bookkeeping; 0 is a span to the bottom.
        rowspans += [int(c.get('rowspan', 1)) or len(rows) - r for c in cells]
        rowspans = [s - 1 for s in rowspans if s > 1]

    # it doesn't matter if there are still rowspan numbers 'active'; no extra
    # rows to show in the table means the larger than 1 rowspan numbers in the
    # last table row are ignored.

    # build an empty matrix for all possible cells
    table = [[None] * colcount for row in rows]

    # fill matrix from row data
    rowspans = {}  # track pending rowspans, column number mapping to count
    for row, row_elem in enumerate(rows):
        span_offset = 0  # how many columns are skipped due to row and colspans
        for col, cell in enumerate(row_elem.find_all(['td', 'th'], recursive=False)):
            # adjust for preceding row and colspans
            col += span_offset
            while rowspans.get(col, 0):
                span_offset += 1
                col += 1

            # fill table data
            rowspan = rowspans[col] = int(cell.get('rowspan', 1)) or len(rows) - row
            colspan = int(cell.get('colspan', 1)) or colcount - col
            # next column is offset by the colspan
            span_offset += colspan - 1
            value = cell.get_text()
            for drow, dcol in product(range(rowspan), range(colspan)):
                try:
                    table[row + drow][col + dcol] = value
                    rowspans[col + dcol] = rowspan
                except IndexError:
                    # rowspan or colspan outside the confines of the table
                    pass

        # update rowspan bookkeeping
        rowspans = {c: s - 1 for c, s in rowspans.items() if s > 1}

    return table
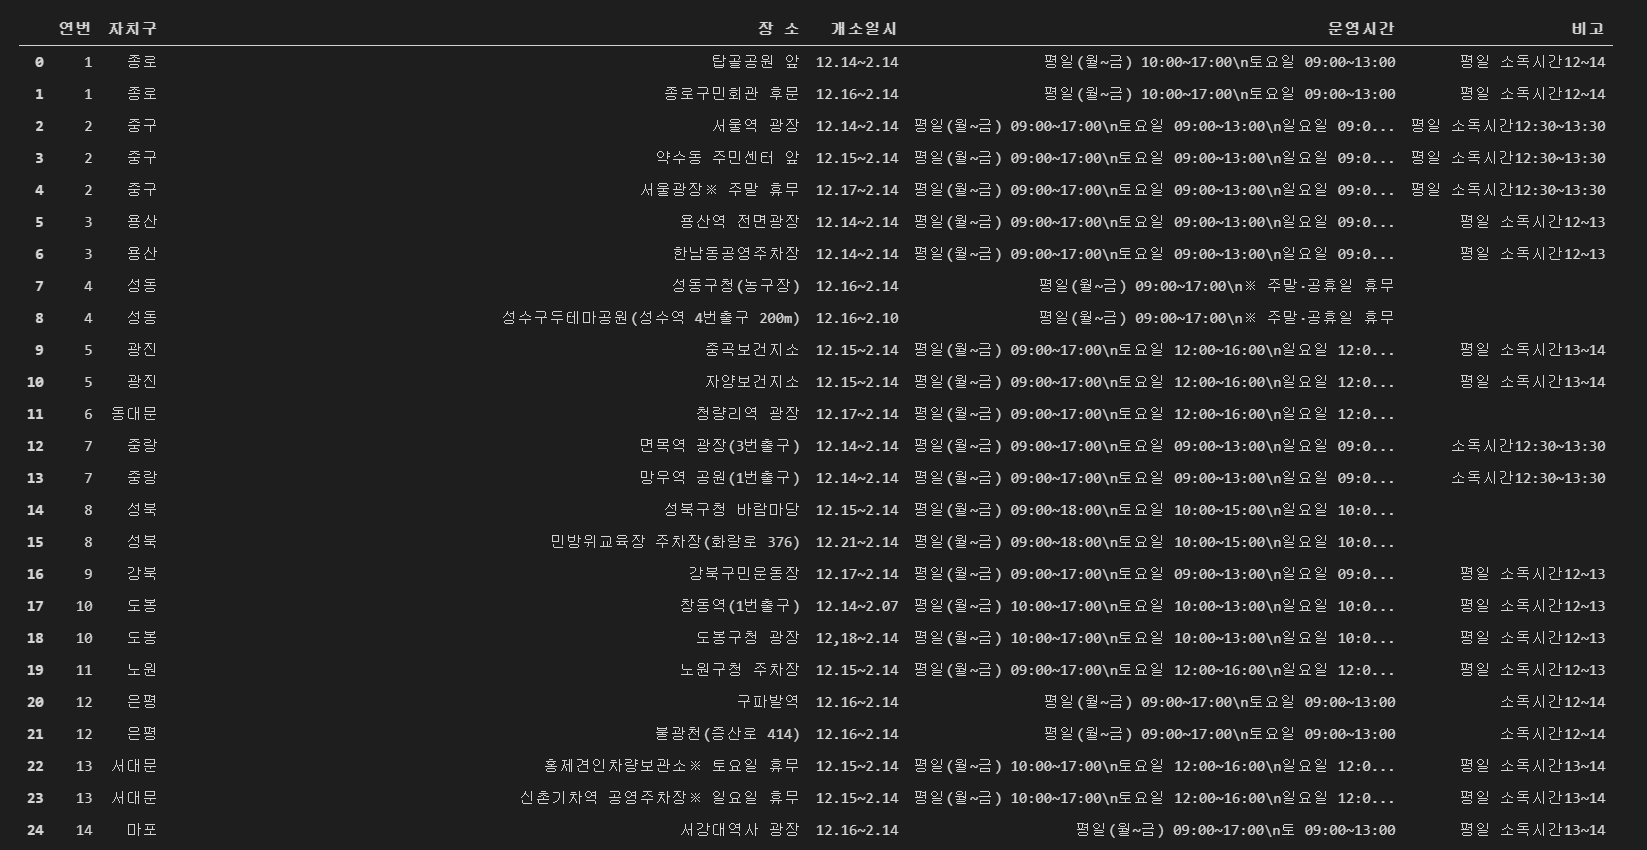
실제데이터로 해보기 : 서울시 임시선별검사소 운영 현황
이 코드를 찾게 된 이유도 서울시 임시선별검사소 운영 현황을 알아보기 위함이었습니다. 제가 최초로 접속했을땐 임시선별소 지도보기가 클릭이 되지 않아 구글 맵으로 만들어야겠다고 마음먹었었죠.
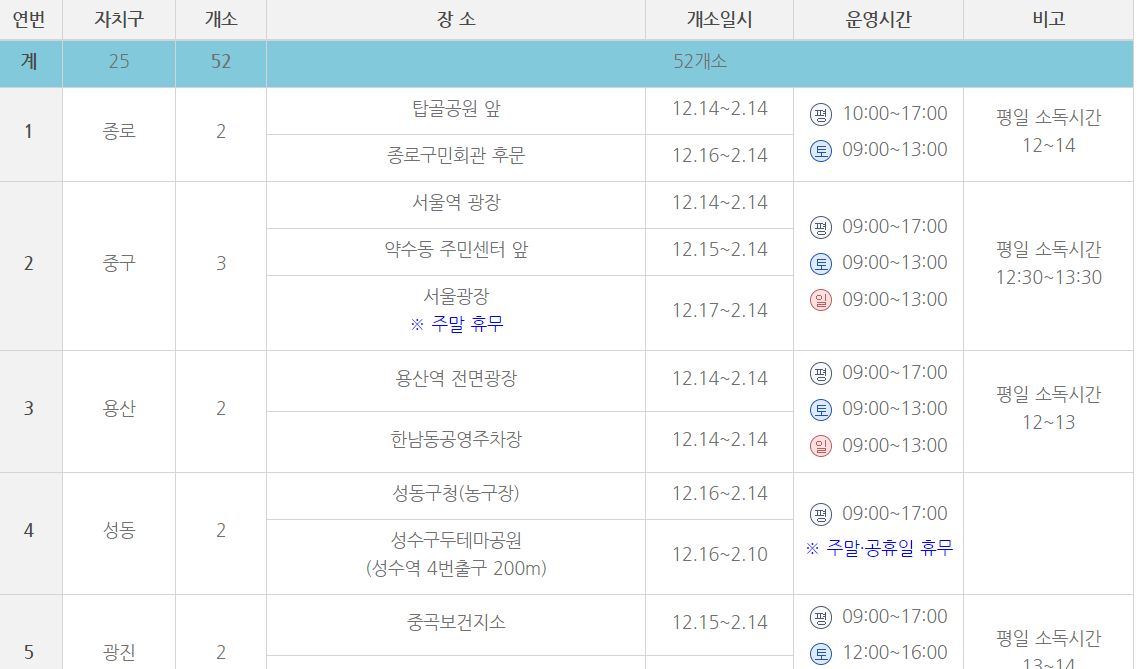
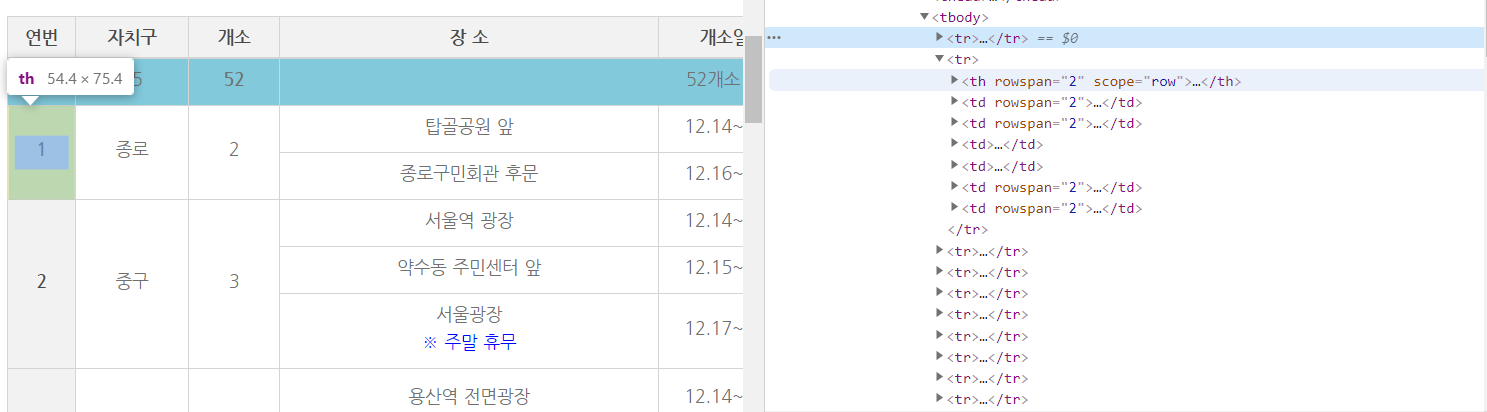
데이터는 위와 같습니다. 비교적 간단하게 합쳐져 있습니다. row by row로 합쳐진 경우는 있지만 column by column으로 합쳐진 경우는 없습니다. 사실 더 자질구레한 설명보단 코드로 직접 돌려보시는게 좋을것 같아 파일 첨부합니다. 안에 주석도 같이 있어서 큰 무리는 없을것 같습니다.
결과
뜬금없이 뛰어넘어 당황스러우실수 있지만 코드를 돌리게되면 다음과 같은 결과를 얻을 수 있습니다. 손으로 직접 노가다해서 거의 2시간 걸린(이것저것 처리하는 것 때문에)것을 코드로 거의 2초면 해결할 수 있습니다.
추후 활용 계획
저는 이 데이터를 구글맵에 넣을 생각으로 정리했습니다. 하지만, 지금 있는 데이터로 턱없이 부족합니다. 왜냐하면 엑셀로 구글맵에 넣을때는 좌표값을 필요로 하기 때문입니다. 언제가 될지 모르겠지만 좀더 공부해서 위의 주소들을 좌표값으로 바꿔보는 것을 해보겠습니다.
참고자료
'아카이브 > 공부노트' 카테고리의 다른 글
| [파이썬] 디버깅을 위한 마음자세와 두가지 프로그램 테스트 방법 (0) | 2021.01.30 |
|---|---|
| [우분투] root 비밀번호 설정하기 (0) | 2021.01.25 |
| [Python / 알고리즘] 재귀용법 이해와 쓰임. (2) | 2021.01.19 |
| [Python / request] request를 이용해 csv파일 가져오기. (0) | 2021.01.18 |
| [파이썬 / python]챕터5: 튜플, 리스트, 앨리어싱, 변경가능, 복제 (Tuples, Lists, Aliasing, Mutability, Cloning) (0) | 2021.01.17 |
![[파이썬] 디버깅을 위한 마음자세와 두가지 프로그램 테스트 방법](http://i1.daumcdn.net/thumb/C176x120.fwebp.q85/?fname=https%3A%2F%2Fblog.kakaocdn.net%2Fdna%2FKdvVF%2FbtqVbXO7K0N%2FAAAAAAAAAAAAAAAAAAAAAJRMlwBVXfNDq7EbkN_5dx1vjmY7__7DdGs2DuBsvbq0%2Fimg.jpg%3Fcredential%3DyqXZFxpELC7KVnFOS48ylbz2pIh7yKj8%26expires%3D1774969199%26allow_ip%3D%26allow_referer%3D%26signature%3DTDQe%252BR3CGE5yS%252B16flsPpf2eFuI%253D)
![[우분투] root 비밀번호 설정하기](http://i1.daumcdn.net/thumb/C176x120.fwebp.q85/?fname=https%3A%2F%2Fblog.kakaocdn.net%2Fdna%2FbWnxTV%2FbtqUJXATLgG%2FAAAAAAAAAAAAAAAAAAAAAB9XsgFff-pvM5YZOc0HIGcvb_xZDOJ-tttY552BFEi4%2Fimg.png%3Fcredential%3DyqXZFxpELC7KVnFOS48ylbz2pIh7yKj8%26expires%3D1774969199%26allow_ip%3D%26allow_referer%3D%26signature%3DHuqJB6LBfqBwSxAoR5LZJy%252B6Lwo%253D)
![[Python / request] request를 이용해 csv파일 가져오기.](http://i1.daumcdn.net/thumb/C176x120.fwebp.q85/?fname=https%3A%2F%2Fblog.kakaocdn.net%2Fdna%2Fl9zZ9%2FbtqTLyKunLL%2FAAAAAAAAAAAAAAAAAAAAADzEVGg7ol_9tV_k8aPhsW_gwT_ZmGeeeDrDxLJ0Q60Z%2Fimg.png%3Fcredential%3DyqXZFxpELC7KVnFOS48ylbz2pIh7yKj8%26expires%3D1774969199%26allow_ip%3D%26allow_referer%3D%26signature%3DHUICJx9Z4RqI%252BI1iBtLRsmoEbGc%253D)